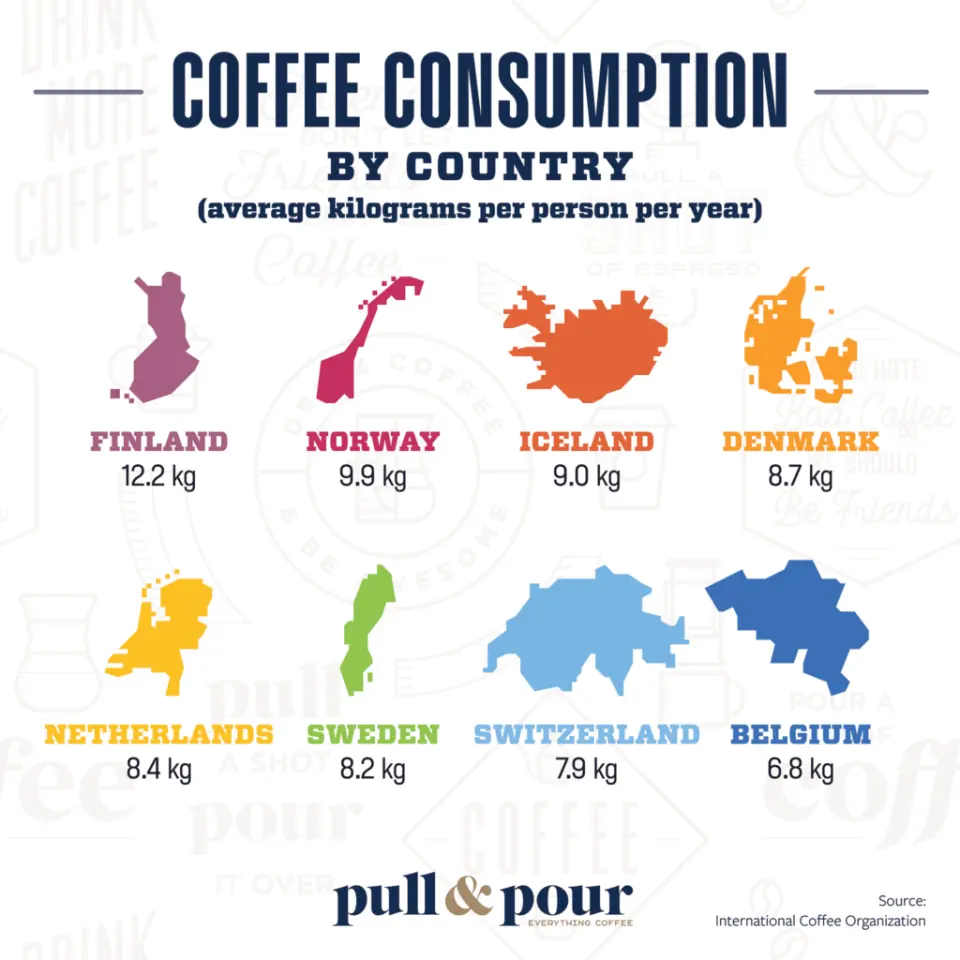
The source turns coffee statistics into visual comparisons, including consumption rankings and separate production views for all coffee and for Arabica. Those are different questions, so a country's position in one graphic should not be silently transferred to the other.
Before interpreting a consumption chart, check whether it measures total volume or consumption per person. Before interpreting production, check the crop year, units and whether Robusta is included. A polished image can make a pattern easier to see without establishing that the underlying figures remain current.
Use the article as a guide to reading infographic choices rather than as a live global league table. For present comparisons, return to the dated dataset and its definitions. That keeps a useful visualization from turning an old ranking or a category difference into an unsupported statement about the industry today.
The conversation
A good question can make a better brew.